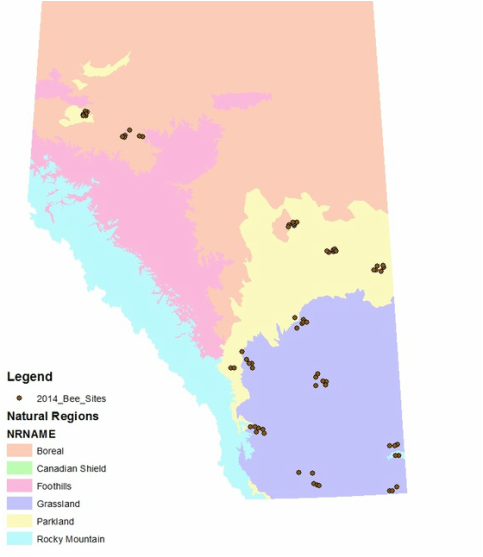
 Figure 4. Distribution of 2014 sampling locations across Alberta's Natural Regions. Each cluster contains approximately half canola and half rangeland sites.
Pollinator communities were surveyed in native rangelands (n=35) and commercial canola fields (n=33) during the 2014 growing season. Sites were distributed across the southern grasslands, central parkland, and northwestern agricultural zone of Alberta (Figure 4). Rangeland and canola sites occurred in clusters throughout these regions, where clusters contained both site types occurring approximately 3-10 km apart.
Each site was visited twice between mid-June and mid-August, and the native bee community was surveyed using two collection methods: pan trapping and netting (Lebuhn et al. 2013). Coloured pan traps were placed in three 36 m transects at each site. To collect larger bees that are less attracted to pan traps, we did an hour of focal netting at mid-day (peak flight times) to ensure collection of the highest diversity of bees (Figure 5). In canola fields, traps and netting occurred in both the field margins and the crop edge. Additional information on flowering diversity and abundance, as well as weather data were collected at each site. Collected specimens were sorted and identified to genera, and then to species for groups where identification guides are available (Figure 6).
Using the data from the first visit in 2014, potential detection bias from weather factors was evaluated by comparing average temperature, wind speed, cloud cover, and sampling effort to total bee detection levels using linear regression.

Figure 5. A technician netting for bees in a canola field.
|
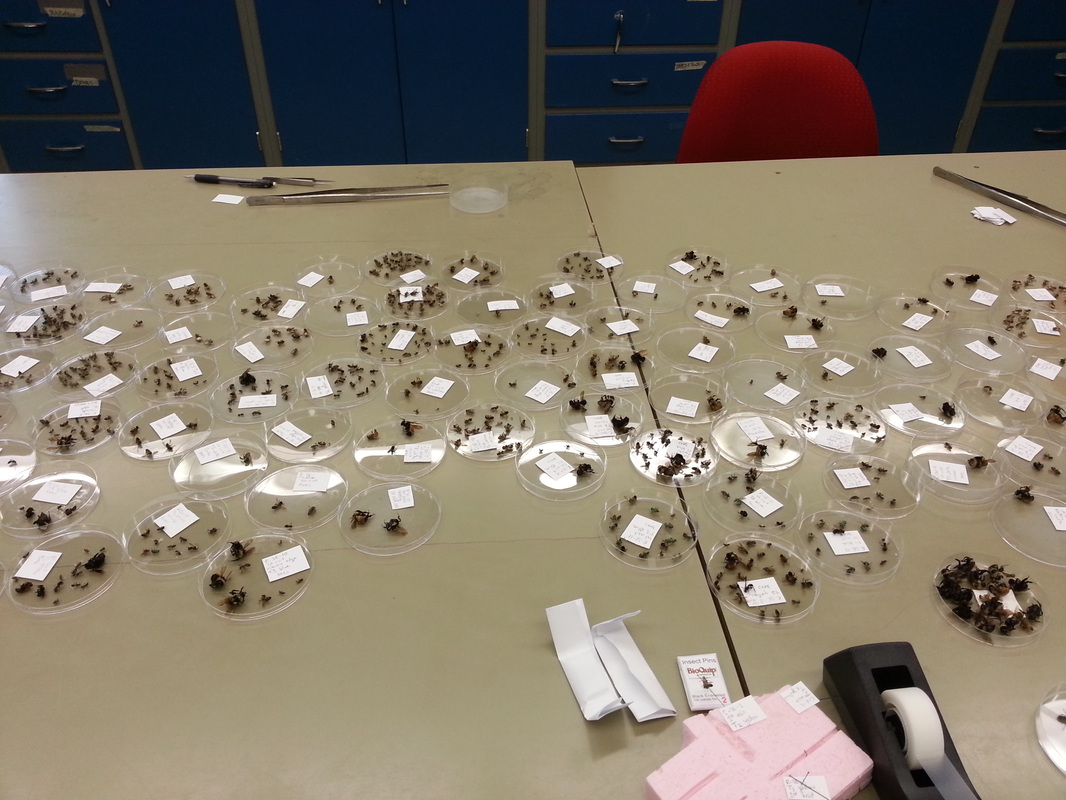
Figure 6. Sorting table for processing the 2014 specimens.
|
To explore differences in bee communities across regions, sub-regions, and canola and rangelands, non-metric-multi-dimensional scaling (NMDS) ordination was conducted using the 13 most common genera of bees. Ordination was used to look for similar groups of sites with the following grouping scenarios: natural regions, rangeland vs. canola, and natural sub-region within the Grasslands and Parklands. Permutational multivariate analysis of variance (perMANOVA) was used to test the strength of the differences between these different groupings. A multivariate regression tree was used to identify splits in the data that explained the most variance in bee communities with the following factors as options for split categories: site type (rangeland vs. canola), region, sub-region, and sampling cluster. Species indicator analysis was used to identify bee genera that were strongly associated with different regions, sub-regions, or site type.
